Data headlines from the World Cities Culture Report: 5th Edition
This page provides an overview of headline statistics from the World Cities Culture Report: 5th Edition. You can find the full dataset and compare across cities using our data explorer tool, as well as well as our regional trends map.
THE CITY DATA
This data was collected from our cities using a framework and indicators developed in collaboration with the Organisation for Economic Co-operation and Development (OECD). For more information, see our Methodology.
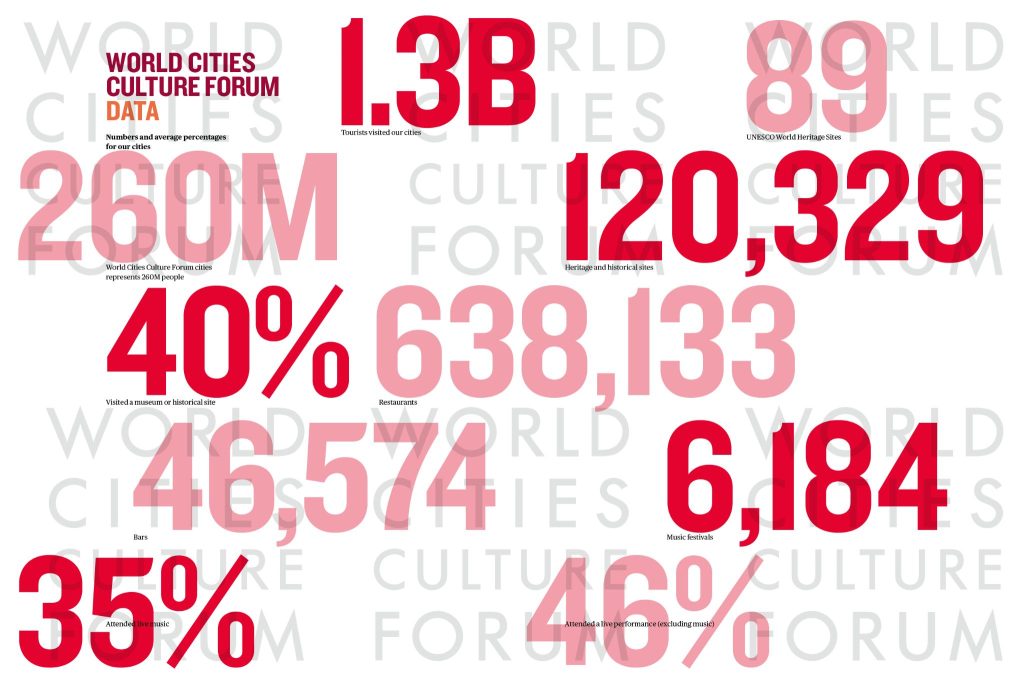
- World Cities Culture Forum represents 260M people
- 1.3B tourists visited our cities
- 89 UNESCO World Heritage Sites
- 120,329 heritage and historical sites
- 638,133 restaurants and 46,574 bars
- 6,184 music festivals
- 40% visited a museum or historical site
- 35% attended live music
- 46% attended a live performance (excluding music)
CULTURE INFRASTRUCTURE AND EVENTS DATA
This data was collected from our cities using a framework and indicators developed in collaboration with the Organisation for Economic Co-operation and Development (OECD). For more information, see our Methodology.
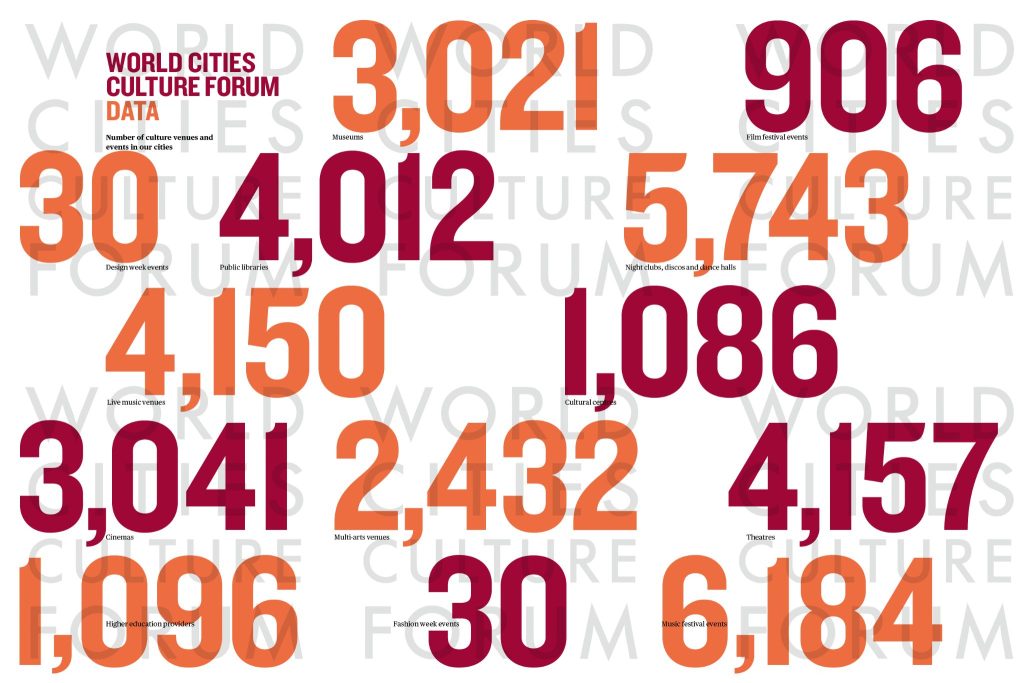
- 3,021 museums
- 4,012 public libraries
- 4,157 theatres
- 3,041 cinemas
- 1,086 cultural centres
- 4,150 live music venues
- 2,432 multi-arts venues
- 1,096 higher education providers in the city
- 5,743 night clubs, discos and dance halls
- 30 fashion week events
- 906 film festival events
- 6,184 music festival events
- 30 design week events
CULTURAL POLICY DATA
This data was collected through the World Cities Culture Forum City Policy Survey. For more information, see our Methodology.
- Creative Workspaces 94% of cities are actively working to support and secure spaces for creatives and 41% have policies supporting cultural and creative districts
- Climate and Culture 88% of cities’ culture departments collaborate with environment or climate department and 21% have a designated climate role in the culture department
- Night-Time Economy 97% of cities are working to support the night-time economy and 59% have a night-time economy strategy
- Youth and Education 66% of cities engage young people in shaping cultural policy and 97% have initiatives to support creative education and youth participation
CONTEXT: THE GLOBAL DATA
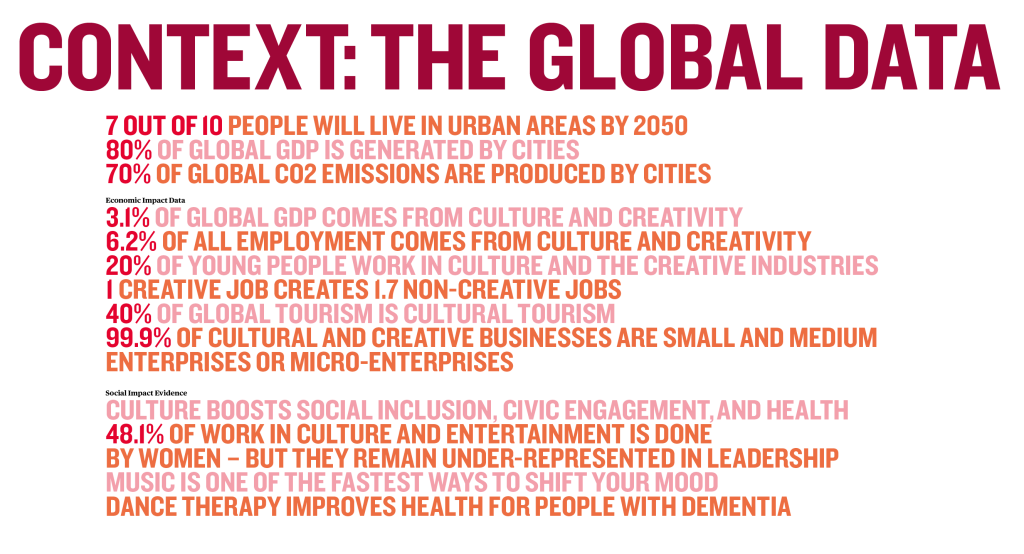
- 7 out of 10 people will live in urban areas by 2050 (UN, 2022)
- 80% of global GDP is generated by cities (UN, 2022)
- 70% of global CO2 emissions are produced by cities (UN, 2022)
Economic Impact data
- 3.1% of global GDP comes from culture and creativity (UNESCO, 2022)
- 6.2% of all employment comes from culture and creativity (UNESCO, 2022)
- 20% of young people work in the culture and the creative industries (UNESCO, 2021)
- 1 creative job creates 1.7 non-creative jobs (UNESCO, 2021)
- 40% of global tourism is cultural tourism (UNESCO, 2021)
- 99.9% of cultural and creative businesses are small and medium enterprises or micro-enterprises (OECD, 2023)
Social Impact evidence
- Culture boosts social inclusion, civic engagement, and health (OECD, 2022)
- 48.1% of work in culture and entertainment is done by women – but they remain under-represented in leadership (UNESCO, 2022)
- Music is one of the fastest ways to shift your mood (Trends in Cognitive Sciences, 2019)
- Dance therapy improves health for people with dementia (Current Alzheimer Research, 2017)